Miniapp Examples

These interactive miniapps are inspired by real customer use cases, white-labeled to fit AlmaProtect, our fictitious company — so every dashboard, heatmap, and analysis shows the kind of app Upside builds from your go-to-market data, with illustrative numbers in place of real ones.

Send Time Optimizer preview
Sales

Send Time Optimizer

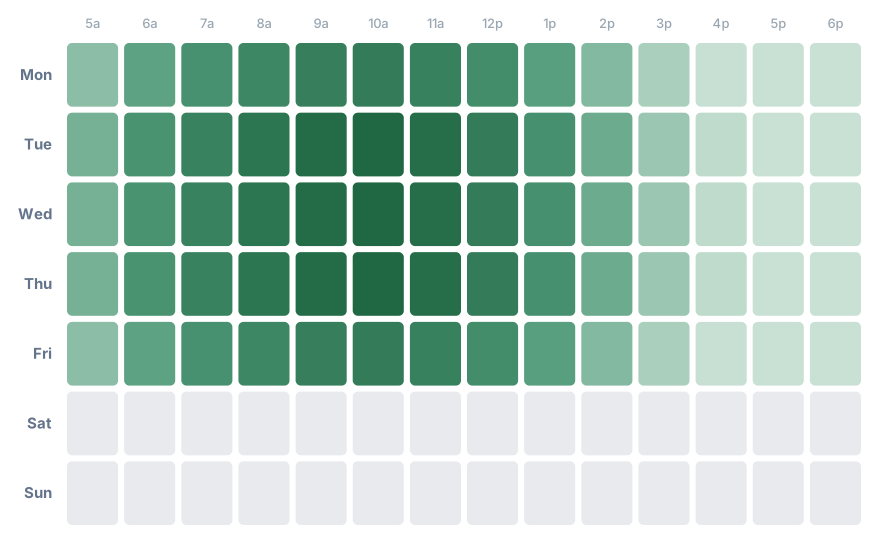
Interactive heatmap that finds the day-and-hour windows where outbound sales emails earn the most replies, with audience segmentation, 95% significance testing, a volume-vs-response quadrant, and a what-if reply-lift calculator.

HeatmapEmailSignificanceSegmentsWhat-if
View example →
AEO Influence Analysis preview
Attribution

AEO Influence Analysis

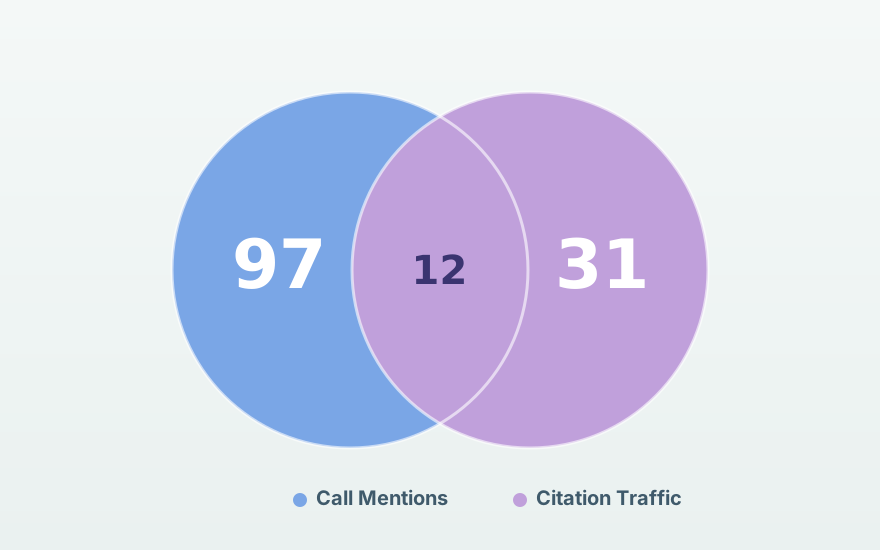
Measures how AI engines (ChatGPT, Perplexity, Gemini, Claude) influence pipeline by fusing citation traffic, call mentions, and CRM notes. Shows win-rate lift, share of voice vs competitors, per-platform sentiment, search themes, and a filterable table of AI-influenced deals with the evidence behind each detection.

AEOShare of VoiceWin-Rate LiftLLMsSentiment
View example →
Channel Analysis preview
Attribution

Channel Analysis

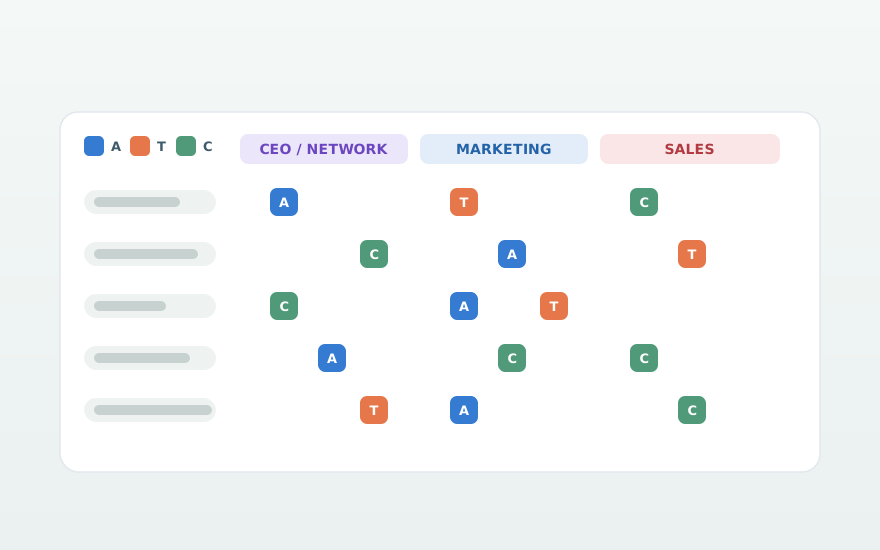
Breaks down which marketing and sales channels influenced closed-won deals across the full buyer journey (awareness, activation, close). Includes a deal-by-channel matrix with touchpoint evidence, per-channel deep dives, a multi-touch attribution comparison, founder-led influence, and prioritized recommendations.

ChannelsBuyer JourneyClosed-WonAttributionMatrix
View example →
Customer Quotes preview
Marketing

Customer Quotes

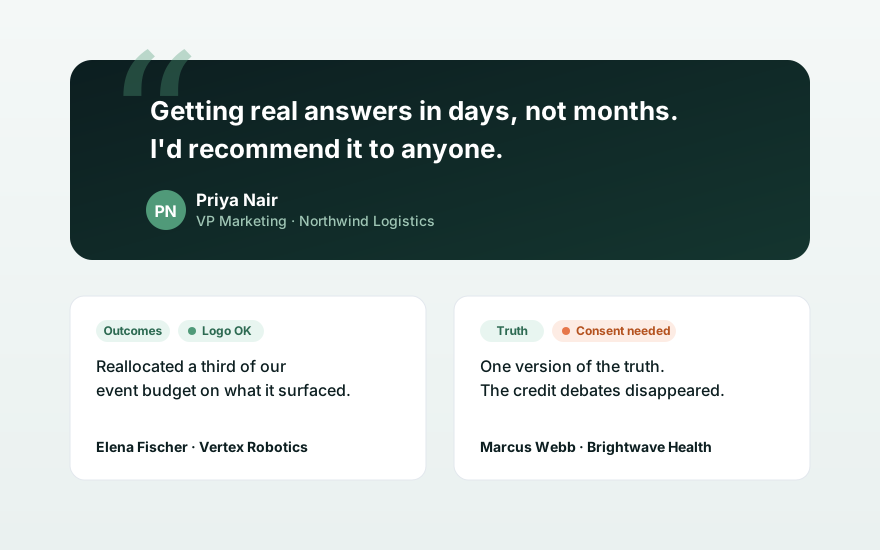
A website-ready voice-of-customer wall that surfaces quotes from call transcripts, alongside the full roster of customers and design partners. Search across quotes and accounts, filter by company, and see each account's logo-use rights so you always know who you can feature publicly.

Voice of CustomerQuotesLogo RightsSearchTestimonials
View example →
Campaign Follow-Up Tracker preview
Sales

Campaign Follow-Up Tracker

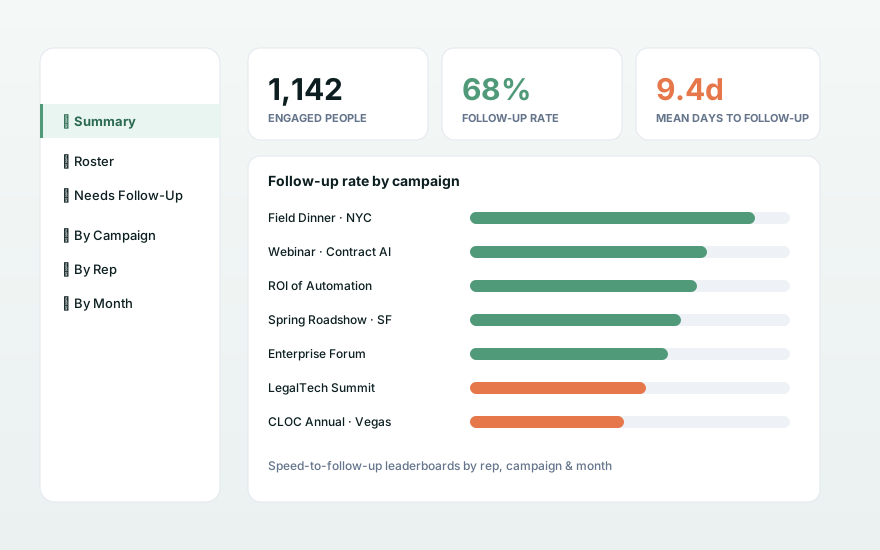
After someone engages with a campaign, how fast does sales follow up — and who's still waiting? A sidebar-organized tracker with a summary of fastest/slowest reps and best/worst campaigns, a per-campaign roster with follow-up status, a 'needs follow-up' routing list grouped by owner, and speed-to-follow-up leaderboards by campaign, rep, and month.

CampaignsSpeed-to-LeadLeaderboardsRosterSales Ops
View example →
The Podcast Effect preview
Attribution

The Podcast Effect

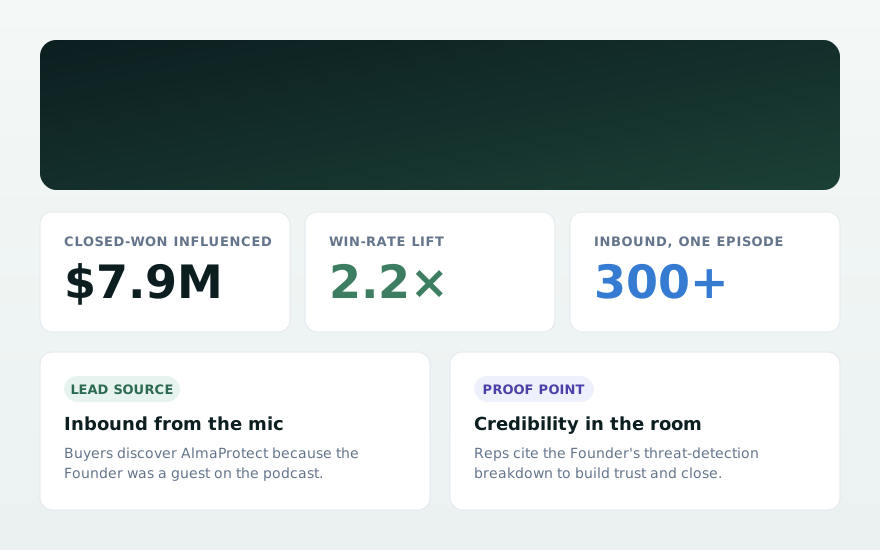
Quantifies how a founder's appearances on a leading security-operations podcast move pipeline, as both a lead source that brings buyers in and a proof point that helps reps close. Tabbed analysis with win-rate lift vs. the company baseline, revenue by quarter, a filterable deal table, a voice-of-customer wall of buyer quotes, an interactive timeline, and a recommended-plays advice tab.

PodcastInfluenceWin-Rate LiftVoice of CustomerAttribution
View example →
Sales Play Identifier preview
Sales

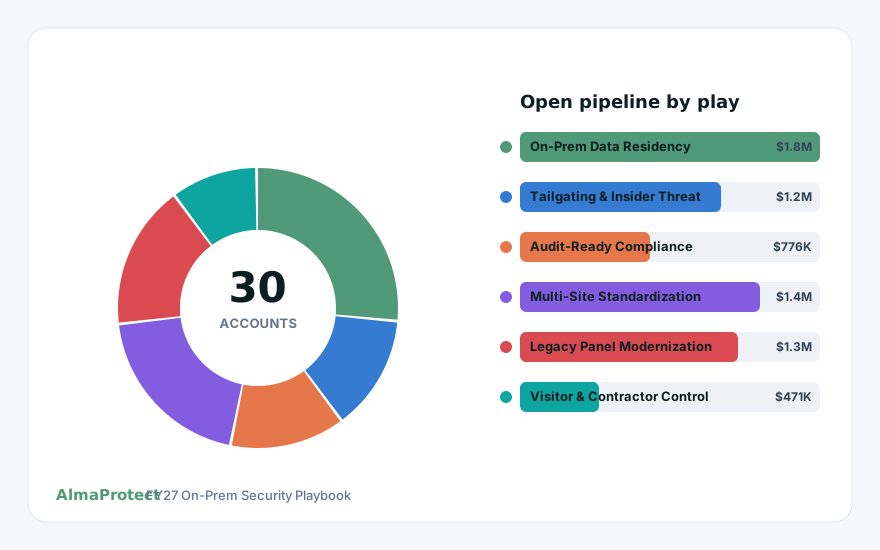
Sales Play Identifier

Scores every account against a sales playbook so reps can see which accounts fit each play, when to run it, and why each one qualifies. Filter, sort, and drill into any account for its fit signals, sales motion, persona coverage, buying triggers, differentiation versus the incumbent, and a ready-to-run action plan with discovery questions, talking points, and objection handling.

Sales PlaysAccount ScoringFit SignalsTargetingPlaybook
View example →
Intent Signals preview
Sales

Intent Signals

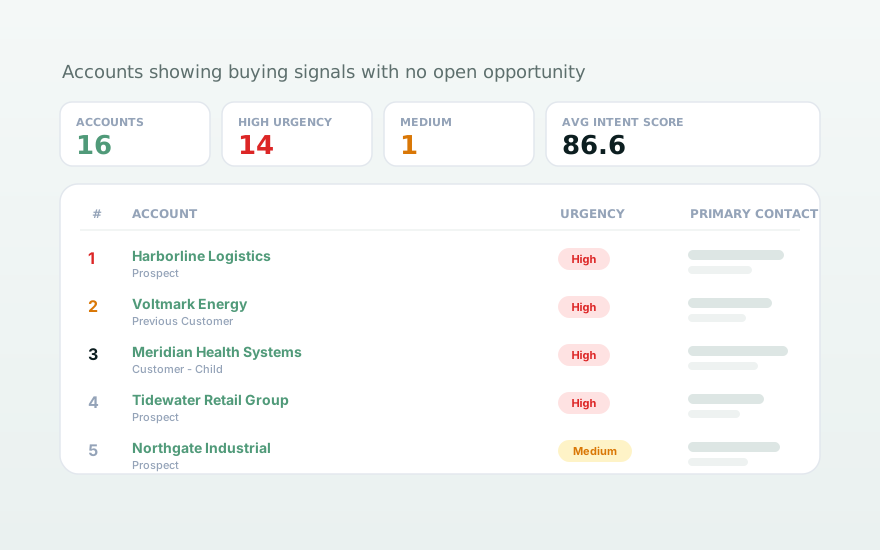
Surfaces accounts showing buying signals with no open opportunity, ranked by intent, with per-account proto-opportunity dossiers, signal timelines, and recommended actions.

IntentProto-opportunitiesPipelineSignals
View example →
Prospect Awareness Analysis preview
Sales

Prospect Awareness Analysis

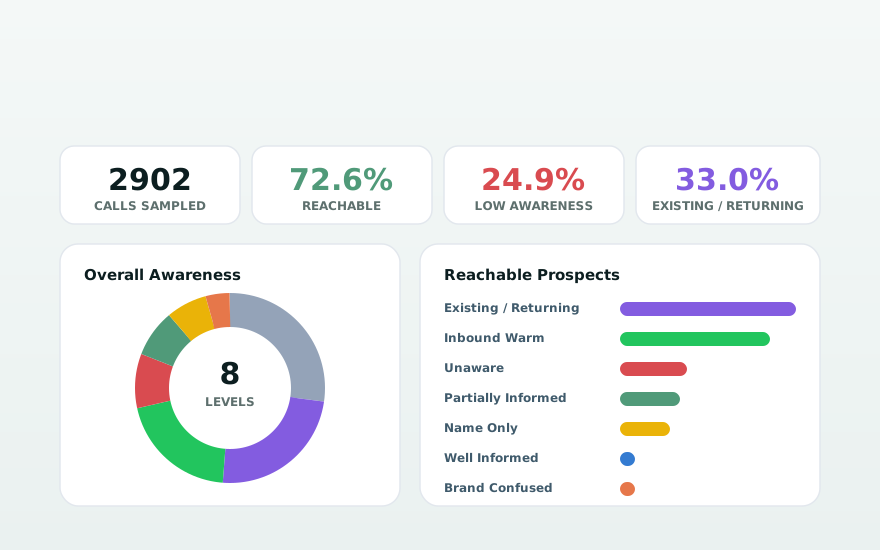
Classifies how much each prospect already knows about AlmaProtect before an SDR call, across 2902 sampled cold and warm calls. Includes an overall awareness donut, a reachable-only breakdown, quarter-over-quarter stacked trends, an 8-level notable-quotes wall, and a searchable, sortable call-detail table with CSV export.

AwarenessSDR CallsTaxonomyQuotesPipeline
View example →
Paid Media Impact preview
Marketing

Paid Media Impact

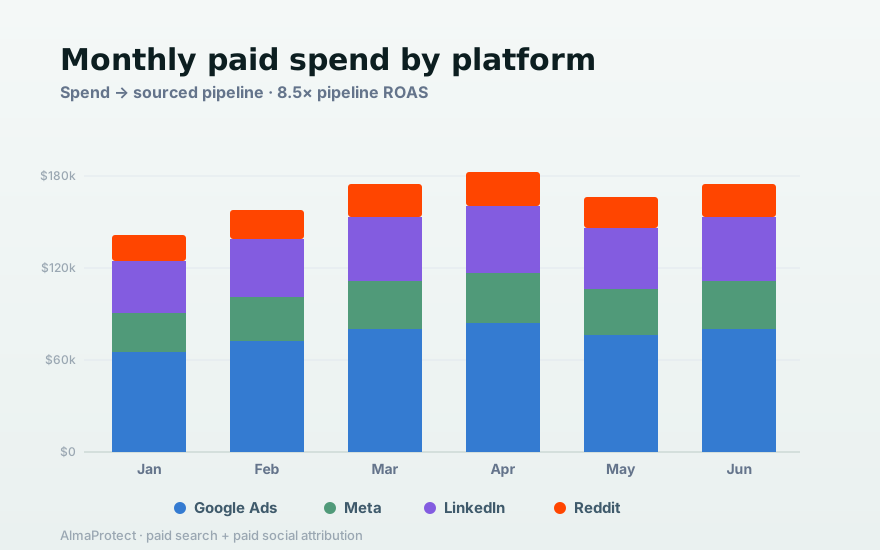
How paid search and paid social turn spend into sourced and influenced pipeline. Combines paid-search performance (campaigns, keywords, landing pages) with paid-media attribution (by platform, net-new vs install base, spend-to-pipeline lag, conversion velocity, and multi-touch journeys) — plus ROAS, cost-per-opp, and strategic recommendations.

Paid SearchPaid SocialROASAttributionPipeline
View example →
Rep Scorecard preview
Sales

Rep Scorecard

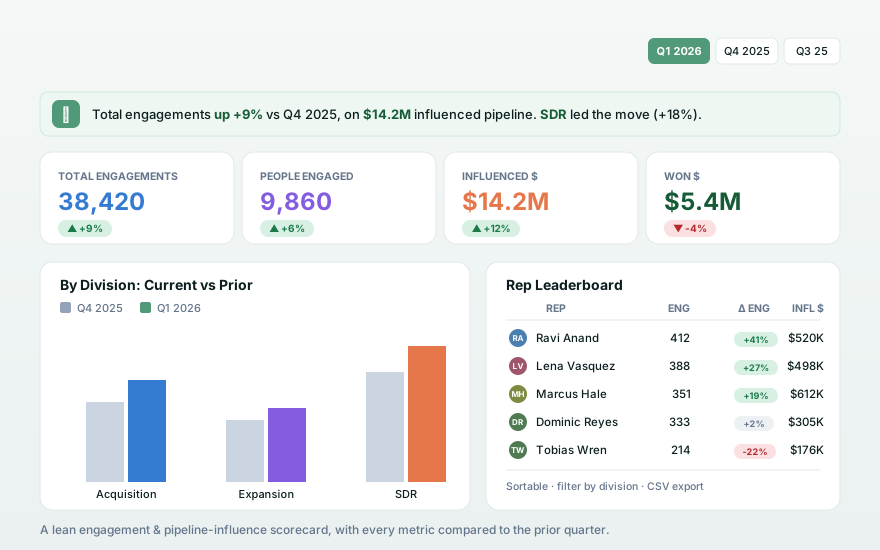
A lean sales rep scorecard that tracks high-signal engagement and opportunity-influence metrics for AlmaProtect's security sales team, rolled up by division and rep with quarter-over-quarter comparison on every KPI, a by-division chart, and a sortable rep leaderboard.

ScorecardRep PerformanceQoQLeaderboardSales Ops
View example →
Product Launch: What's Working preview
Sales

Product Launch: What's Working

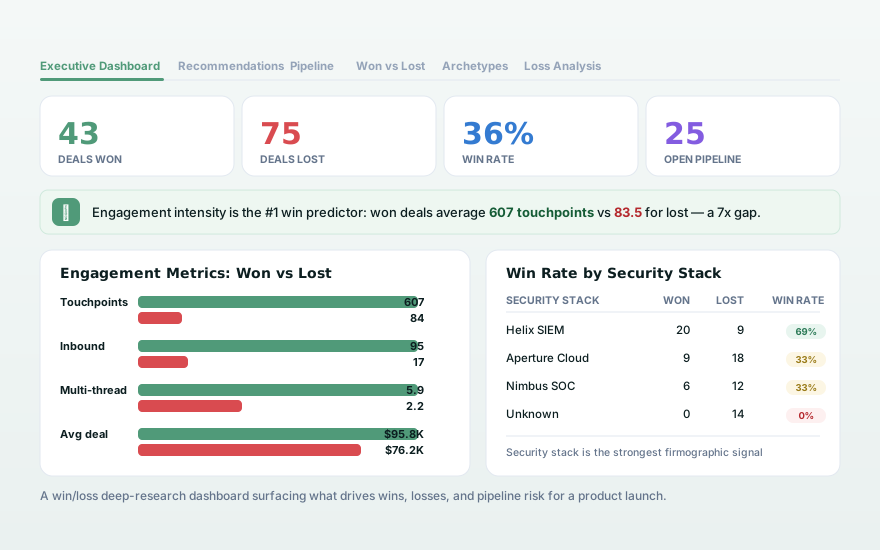
A win/loss deep-research dashboard that analyzes closed deals and open pipeline to surface what's driving a product launch — engagement benchmarks, journey archetypes, loss patterns, messaging signals, and pipeline risk.

Win-LossDeal IntelligencePipelineRevenueDeep Research
View example →
Deal Runbook preview
Sales

Deal Runbook

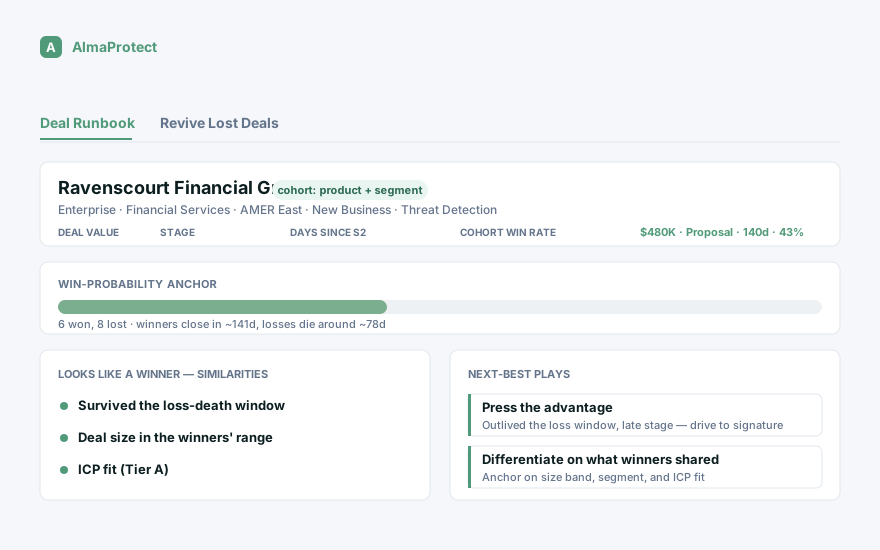
Compares a live opportunity against the patterns in won and lost deals: it picks the closest comparable cohort, anchors a win probability, and contrasts the deal against the winning profile (size band, stage pace, the loss-death window, ICP fit) before raising risk flags and producing a prioritized next-best-play runbook. A second tab scores closed-lost deals for winnability and ranks a revival queue with recommended re-open plays and CSV export.

Win PatternsCohort MatchingRisk FlagsRunbookDeal Revival
View example →
Product Pitch Tracker preview
Sales

Product Pitch Tracker

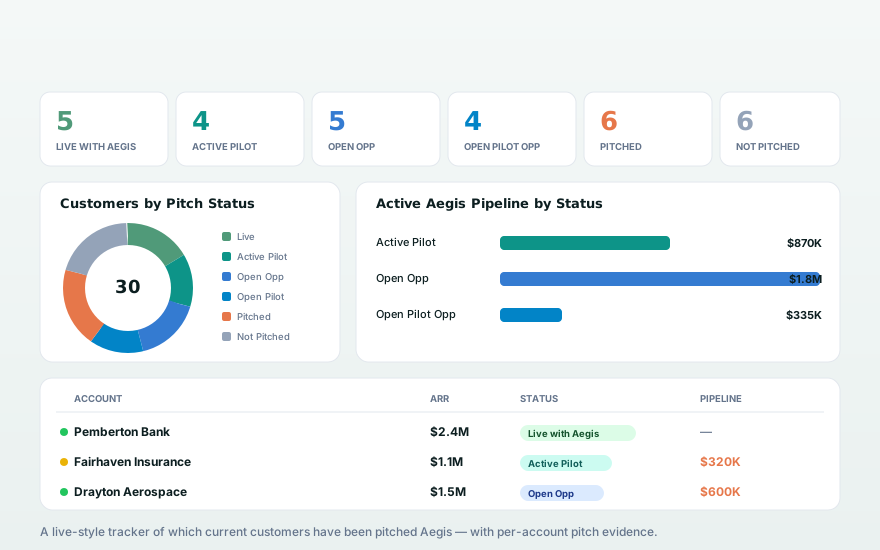
Tracks which accounts have been pitched AlmaProtect's flagship product across a six-stage adoption funnel, with health filters, a sortable account table, and expandable per-account evidence — win wires, formal opportunities, conversations, and marketing influence — plus status charts and CSV export.

Pitch FunnelAccount TrackingWin WireAdoptionSales Ops
View example →
Integrated Campaign Performance preview
Marketing

Integrated Campaign Performance

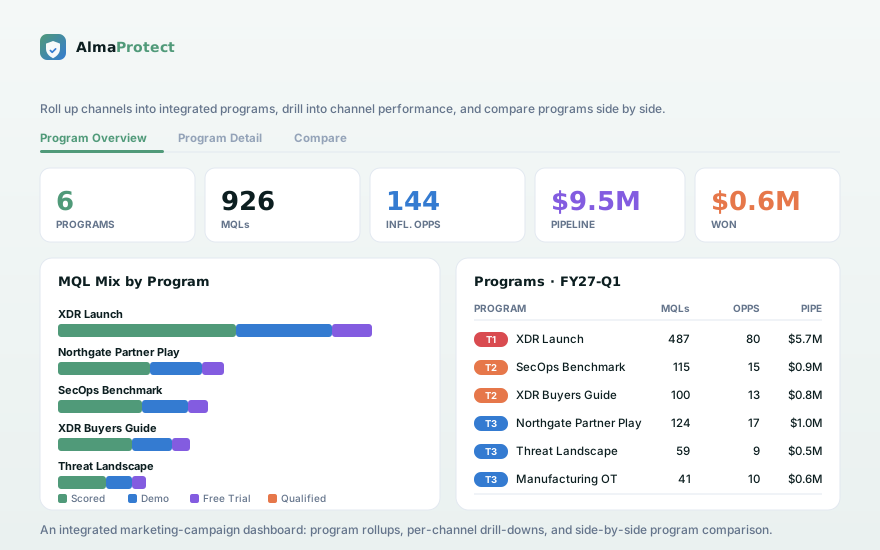
An integrated marketing dashboard that follows every program, channel, and campaign from members through MELs, MQLs, influenced opportunities, Stage 2, pipeline, and closed-won — with a normalize-by-age slider, per-program detail, a side-by-side compare view, and CSV export.

CampaignsChannelsMQLsPipelineAttribution
View example →
Account Coverage Explorer preview
Sales

Account Coverage Explorer

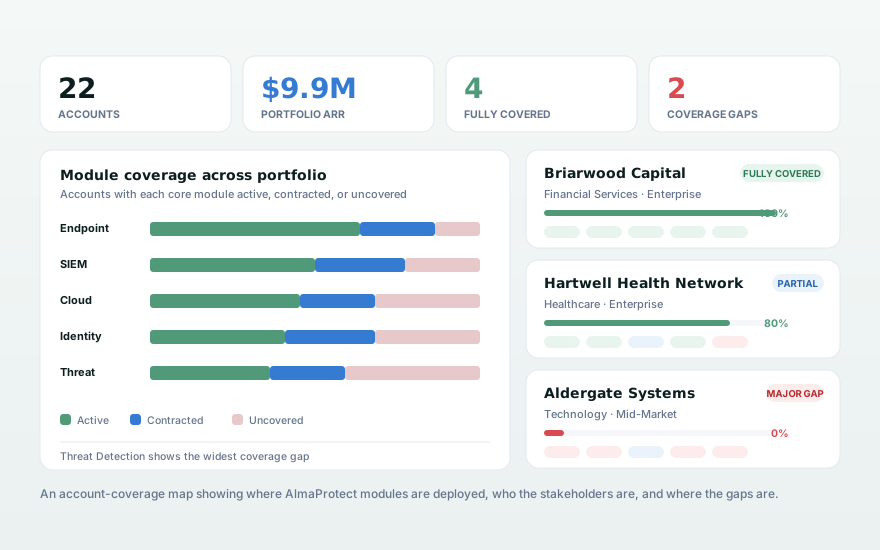
Explores AlmaProtect product-module coverage across the customer base: which core modules (Endpoint, SIEM, Cloud, Identity, Threat Detection) are contracted versus actively engaged at each account, with coverage and engagement scoring, renewal-cycle flags, stakeholder rosters, account plans, and a portfolio coverage chart that spotlights whitespace.

Account CoverageWhitespaceCross-sellRenewalsPortfolio
View example →
Keep / Optimize / Stop preview
Marketing

Keep / Optimize / Stop

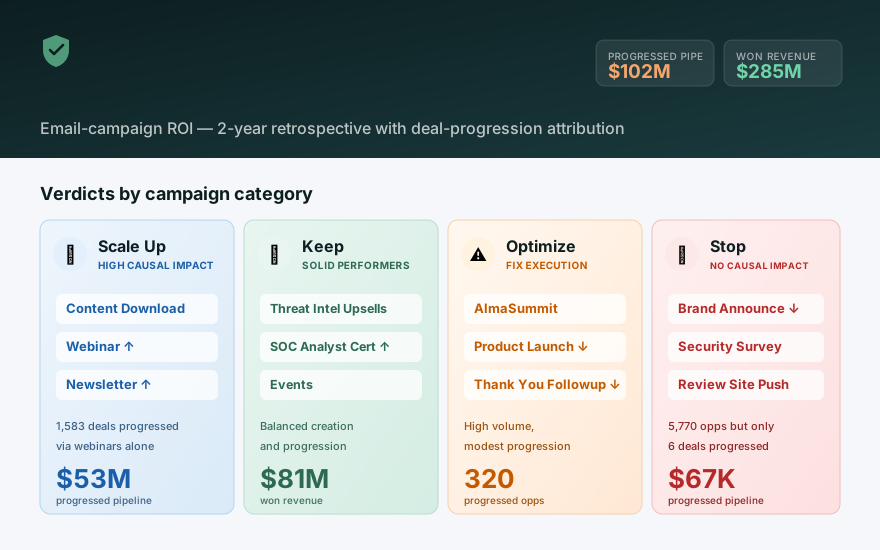
Grades every email-marketing campaign category as Scale Up / Keep / Optimize / Stop using post-engagement attribution and — the deciding signal — whether a touch actually moved a deal to its next stage. Surfaces the "pipeline illusion," contrasts correlation vs causation, ranks top and underperforming campaigns, and ships an 8-play optimization playbook.

Campaign ROIKeep/Optimize/StopAttributionDeal ProgressionEmail
View example →
Funnel Conversion Analyzer preview
Sales

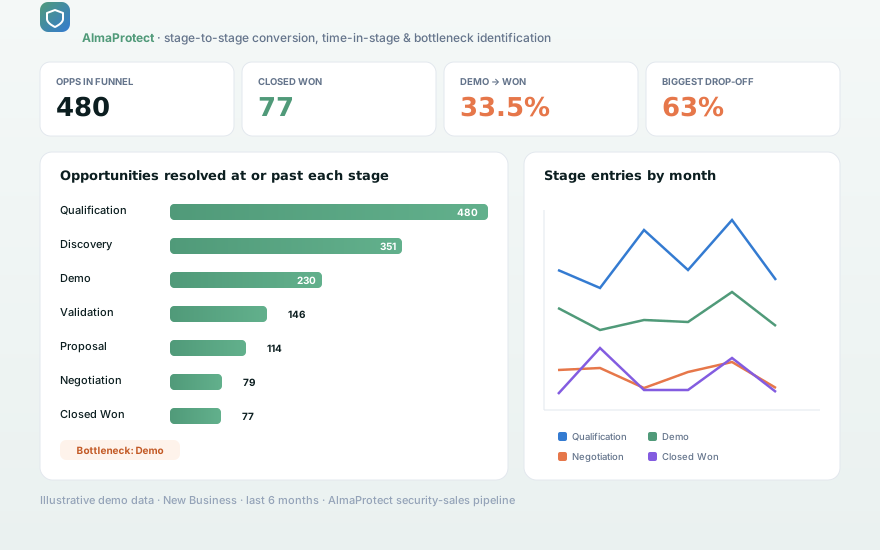
Funnel Conversion Analyzer

A mid-funnel conversion dashboard that uses a resolved-or-past funnel (an opportunity counts toward a stage only once it has closed or advanced beyond it) so conversion isn't inflated by still-active pipeline. Flags the worst-converting transition as the bottleneck, charts time-in-stage and monthly stage entries, and auto-generates key takeaways, with record-type and time-window filters.

FunnelConversionTime-in-StageBottleneckPipeline
View example →
Pipeline Forecast preview
Sales

Pipeline Forecast

Scores every open opportunity against the winning profile distilled from closed-won deals, anchoring a win likelihood and weighted forecast. Tiers deals by confidence, charts the weighted pipeline and timeline, breaks down the scoring factors behind each forecast, and surfaces per-deal risk flags and recommended plays.

ForecastPipelineWin LikelihoodDeal ScoringPlaybook
View example →
Expansion Readiness preview
Sales

Expansion Readiness

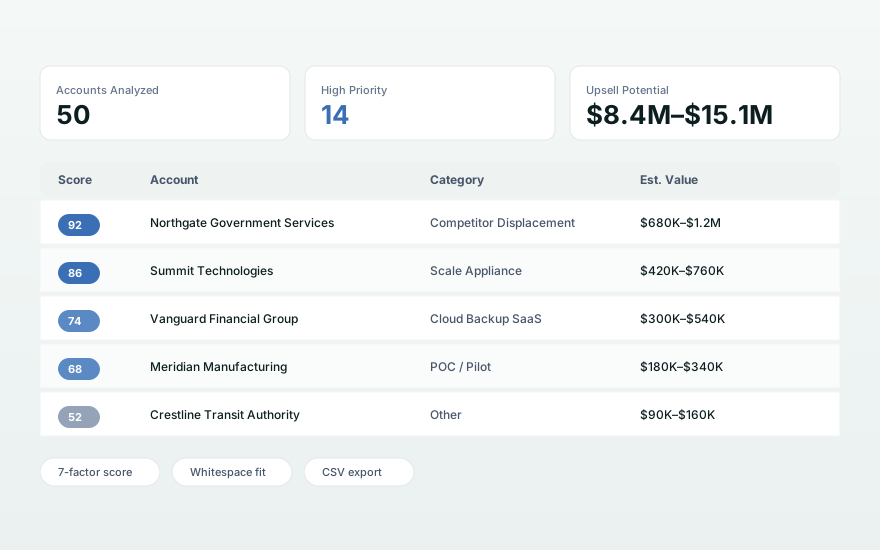
Scores existing customers on their likelihood to expand so the team can prioritize cross-sell and upsell. Combines a 0-100 readiness score across seven weighted factors (land-deal profile, firmographics, buying-group depth, post-land engagement, expansion signals, whitespace fit, and risk) with per-account detail: score breakdown, recommended plays, estimated value, key evidence, top risk, and a full narrative — plus sort, filter, and CSV export.

ExpansionCross-sellAccount ScoringWhitespacePlaybook
View example →
Web Channel Attribution preview
Attribution

Web Channel Attribution

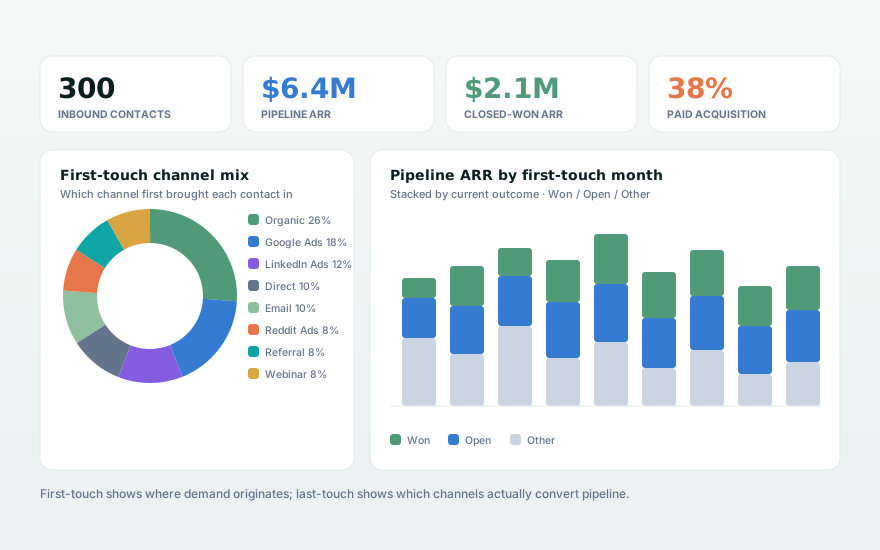
Follows every inbound contact and opportunity from the web channel that first found them (Organic Search, Google Ads, Reddit Ads, LinkedIn Ads, Referral / Partner, Direct, Email, Webinar / Events) through the channel that last touched them before pipeline. A People tab profiles the inbound audience by first- and last-touch channel; an Opportunities tab ties channels to pipeline and closed-won ARR — with first/last-touch doughnuts, a stacked pipeline-by-month chart, sortable type-aware filterable tables, and per-record and per-channel drill-downs.

Web ChannelsFirst/Last TouchAttributionPipelinePaid vs Organic
View example →
Open Deals Forecast preview
Sales

Open Deals Forecast

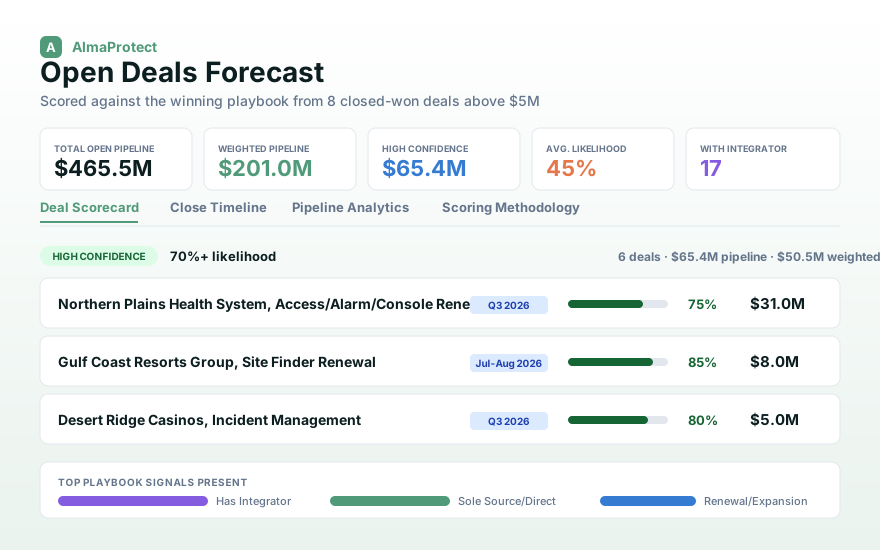
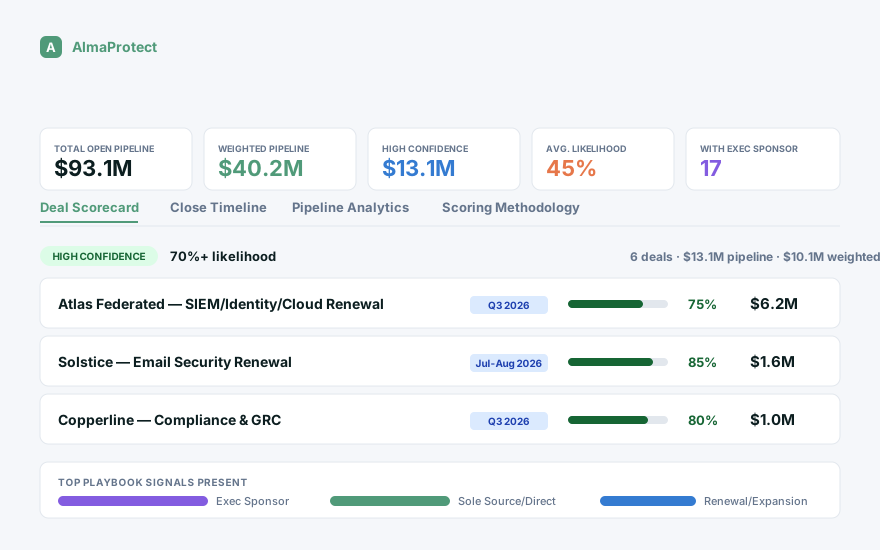
Scores every open deal against the winning profile distilled from closed-won deals, anchoring a win likelihood and weighted forecast across the pipeline. A Deal Scorecard tiers deals by confidence and breaks down the scoring factors (stage, integrator/champion, procurement path, relationship, budget) behind each forecast; a Close Timeline projects when deals land; Pipeline Analytics charts weighted value, and a Scoring Methodology tab documents the model, with per-deal risk flags and recommended plays.

ForecastPipelineWin LikelihoodDeal ScoringPlaybook
View example →
Lost Deals Analysis preview
Sales

Lost Deals Analysis

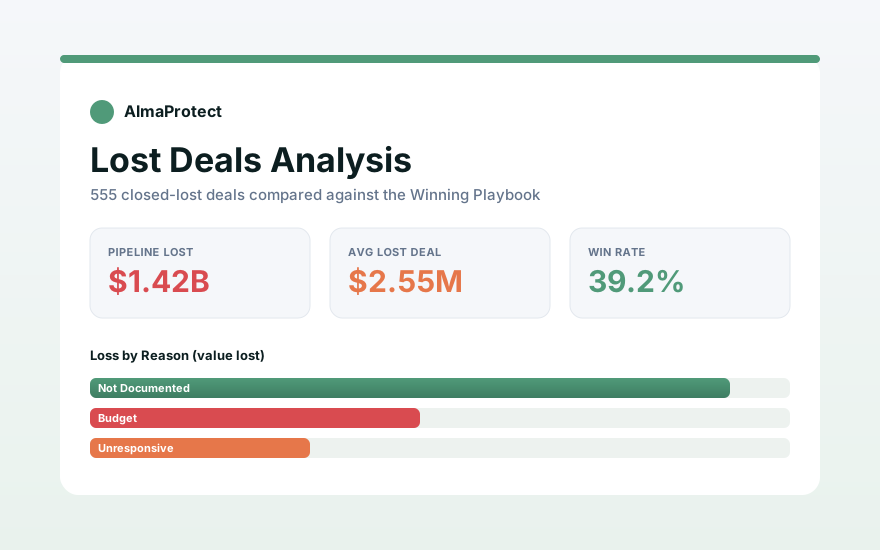
Analyzes every closed-lost deal against the winning playbook to explain why pipeline slips away. Breaks down loss reasons and dollars lost, maps the playbook gaps that separated losses from wins, profiles the biggest lost deals, and turns the pattern into concrete recommendations, with filters across region, product, and loss reason.

Closed-LostLoss ReasonsPlaybook GapsWin/LossPipeline
View example →
Messaging Themes Explorer preview
Marketing

Messaging Themes Explorer

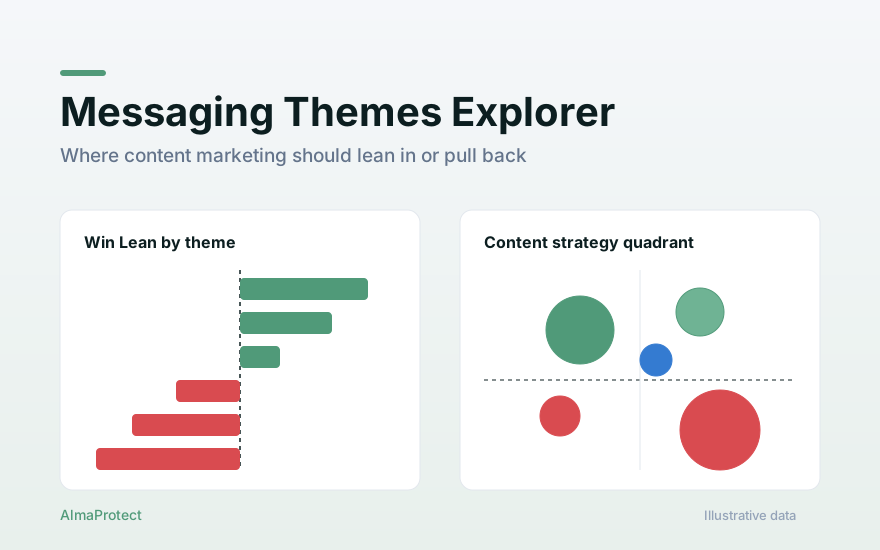
Mines sales-call language to surface the messaging themes that show up in won versus lost deals. Contrasts the words that win against the ones that stall, tracks competitor mentions across conversations, and offers an exportable quote bank so marketing can ground positioning in how buyers actually talk.

MessagingWin/Loss LanguageCompetitorsQuote BankPositioning
View example →
Enterprise ABM Campaign Tracker preview
Marketing

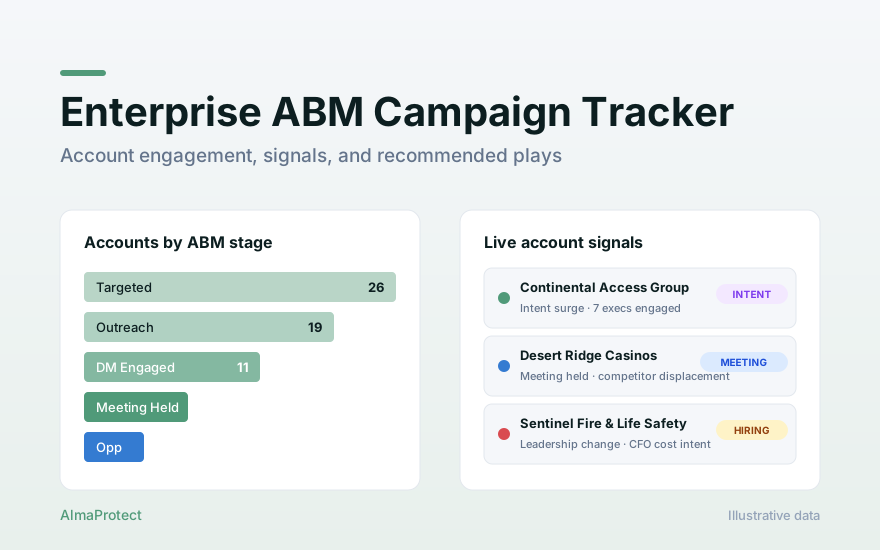
Enterprise ABM Campaign Tracker

An account-based marketing command center that tracks target accounts through the full ABM funnel — Targeted, Outreach, DM Engaged, Meeting Held, and Opportunity — and fuses live buying signals (intent surges, hiring, leadership changes, competitor displacement) with per-account engagement rollups. Each account opens into a dossier of key contacts, touchpoint history, and campaign membership, alongside a recommended-plays feed that turns signals into the next best action.

ABMAccount SignalsEngagementCampaignsRecommended Plays
View example →
Sales Activity Trends preview
Sales

Sales Activity Trends

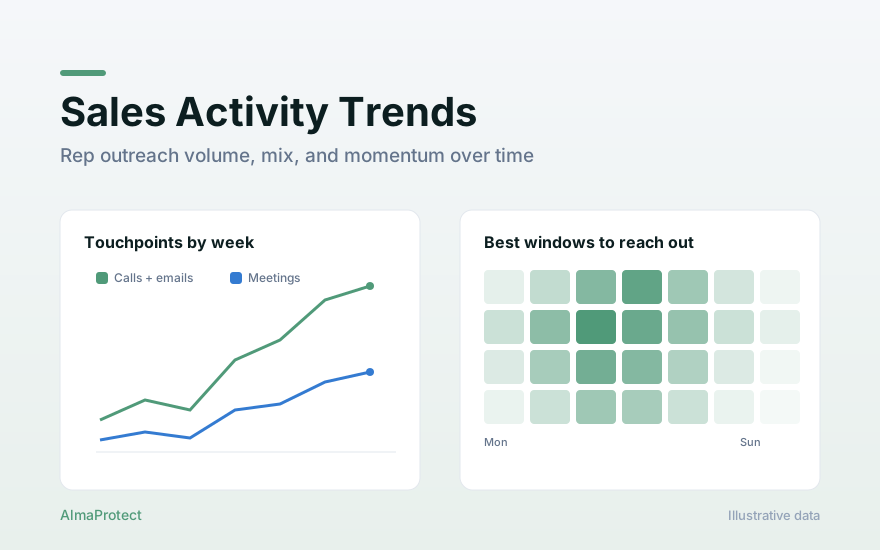
Tracks outbound sales activity across the AlmaProtect team — calls, emails, and meetings — to show how volume, channel mix, and momentum move over time. Rolls up by rep and role, charts weekly trends and new-opportunity creation, and surfaces a day-and-hour heatmap of the windows where reps are most active, with filters and CSV export.

Sales ActivityOutboundHeatmapRep RollupsTrends
View example →
Inbound Leads & Re-Engagement Explorer preview
Sales

Inbound Leads & Re-Engagement Explorer

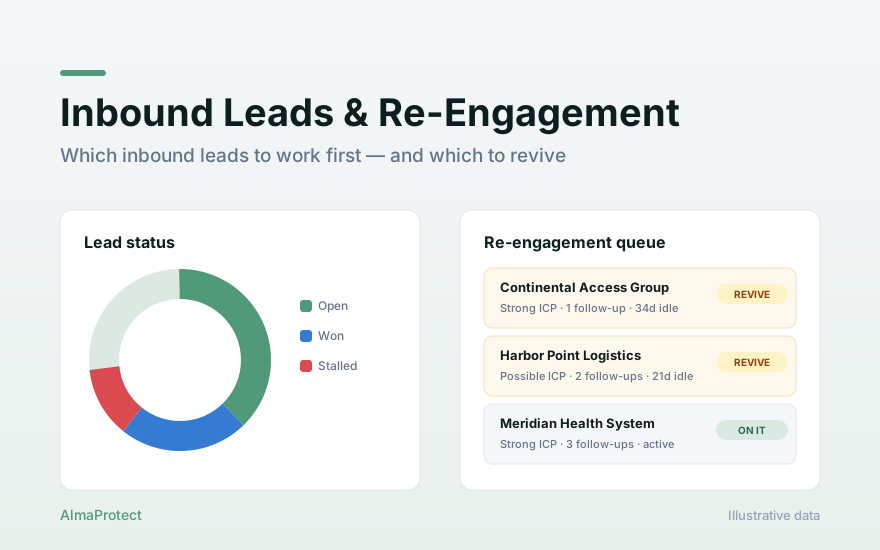
Explores every inbound lead by status, source, and ICP fit so reps know which to work first — and which to revive. Flags a re-engagement queue of strong- and possible-fit leads that stalled with too few follow-ups, charts status and follow-up gaps, and ships a sortable, filterable table with lead profiles and CSV export.

Inbound LeadsRe-EngagementICP FitFollow-upsPipeline
View example →
Prospect Question Themes preview
Marketing

Prospect Question Themes

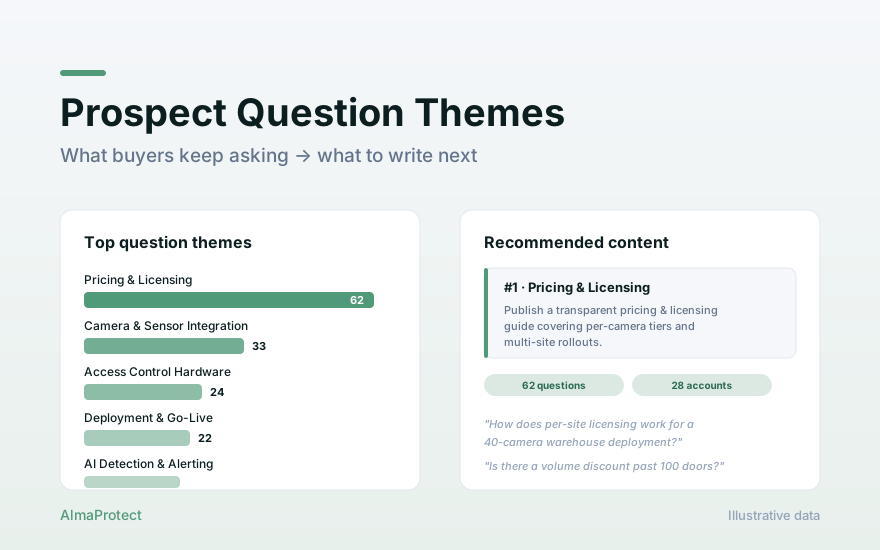
Mines the questions prospects ask on sales calls and clusters them into themes — pricing, camera integration, access control, deployment, AI detection, and more — then turns each theme into a recommended content idea ranked by demand. Shows question and account counts per theme, a demand bar chart, and expandable verbatim questions behind every recommendation.

Question ThemesContent IdeasVoice of CustomerDemandMarketing
View example →
Buying Group & Touchpoints Explorer preview
Sales

Buying Group & Touchpoints Explorer

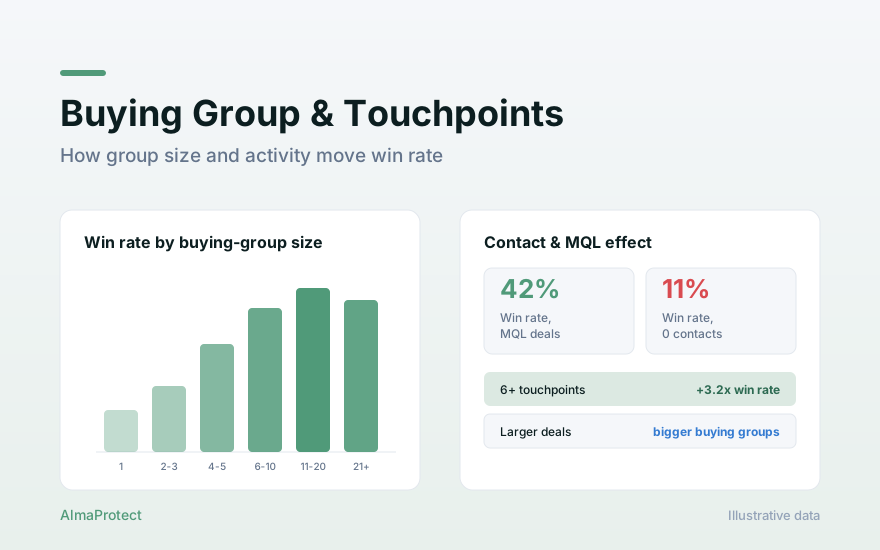
Explores how buying-group size, sales touchpoints, MQL status, and deal size relate to win rate across the AlmaProtect book of business. Charts win rate by group size and contact count, MQL lift by deal size and year, and a 'why deals win' breakdown across cycle length, amount, touchpoints, and group depth — with years, motion, and status filters that recompute instantly.

Buying GroupsTouchpointsWin RateMQLDeal Size
View example →
Marketing ROI Dashboard preview
Marketing

Marketing ROI Dashboard

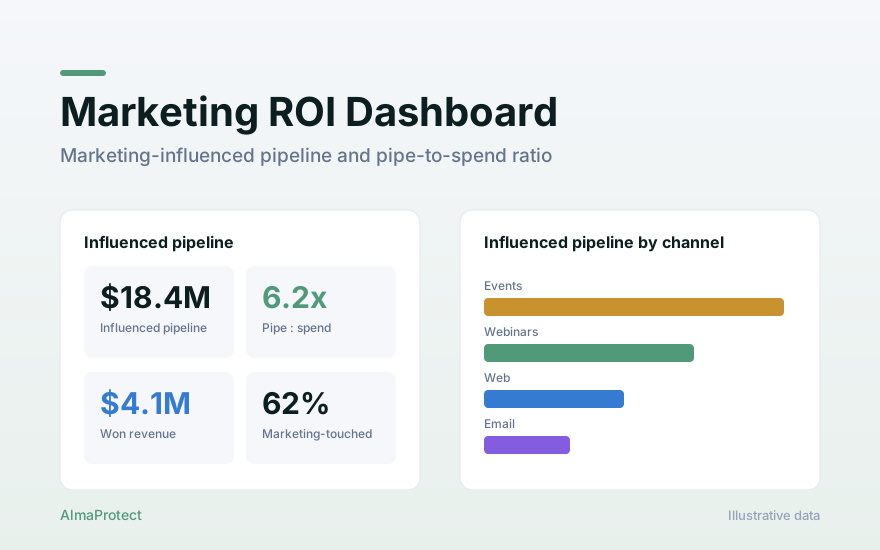
A board-level view of marketing-influenced pipeline and return on spend across the AlmaProtect book. Tracks total and influenced pipeline, won revenue, and the pipeline-to-spend ratio, with a created-vs-assisted split, net-new vs expansion, pipeline by channel and by vertical, quarterly trend, and a campaigns-by-influence table — all recomputing instantly against an adjustable attribution window and fiscal period.

Marketing ROIInfluenced PipelineAttributionCampaignsPipe:Spend
View example →
Pipeline Source Attribution preview
Attribution

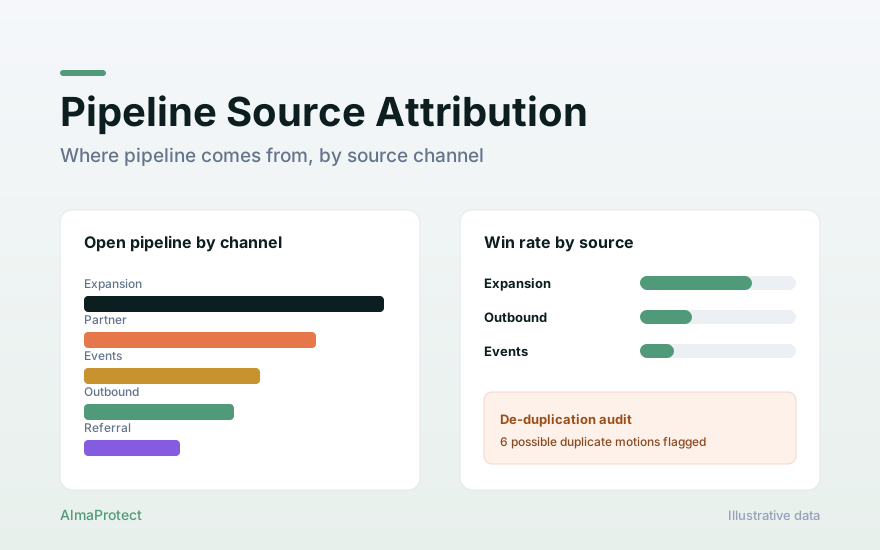
Pipeline Source Attribution

Reconstructs where AlmaProtect pipeline actually comes from by source channel, using first-touch evidence on a de-duplicated parent-account rollup. Reconciles sourced vs influenced pipeline, shows win rate by source, partner and advisor overlays, and a de-duplication audit that flags possible duplicate buying motions — with status filters and an adjustable date range that drives every tab.

Source AttributionSourced vs InfluencedWin RateDe-duplicationPipeline
View example →

Build your own

Connect your go-to-market data and turn a prompt into an interactive app like these, using your own numbers.

Request Demo